
01 · Where the gaps are
The whole portfolio, on one screen
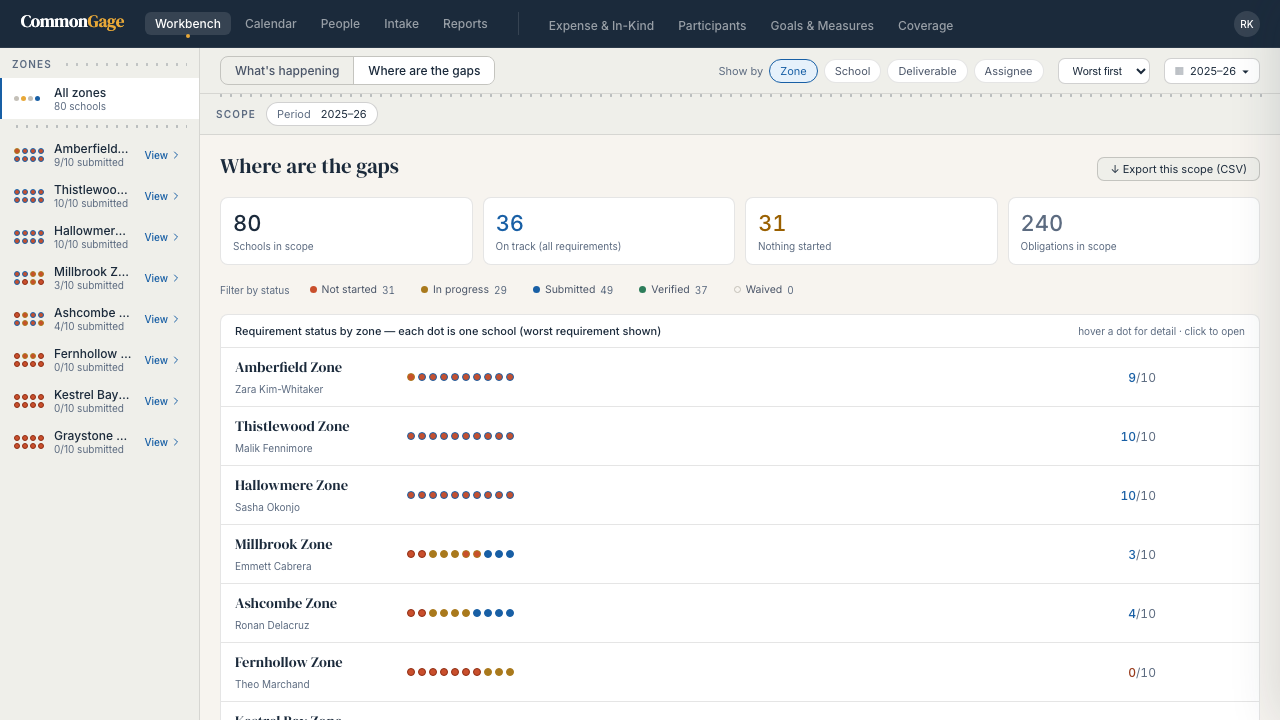
Every dot is a school, colored by its worst requirement. 80 schools across 8 zones, 240 obligations tracked, 31 with nothing started yet — something no end-of-year report catches in time.
02 · What's actually happening
Not just whether it's done — what's actually happening
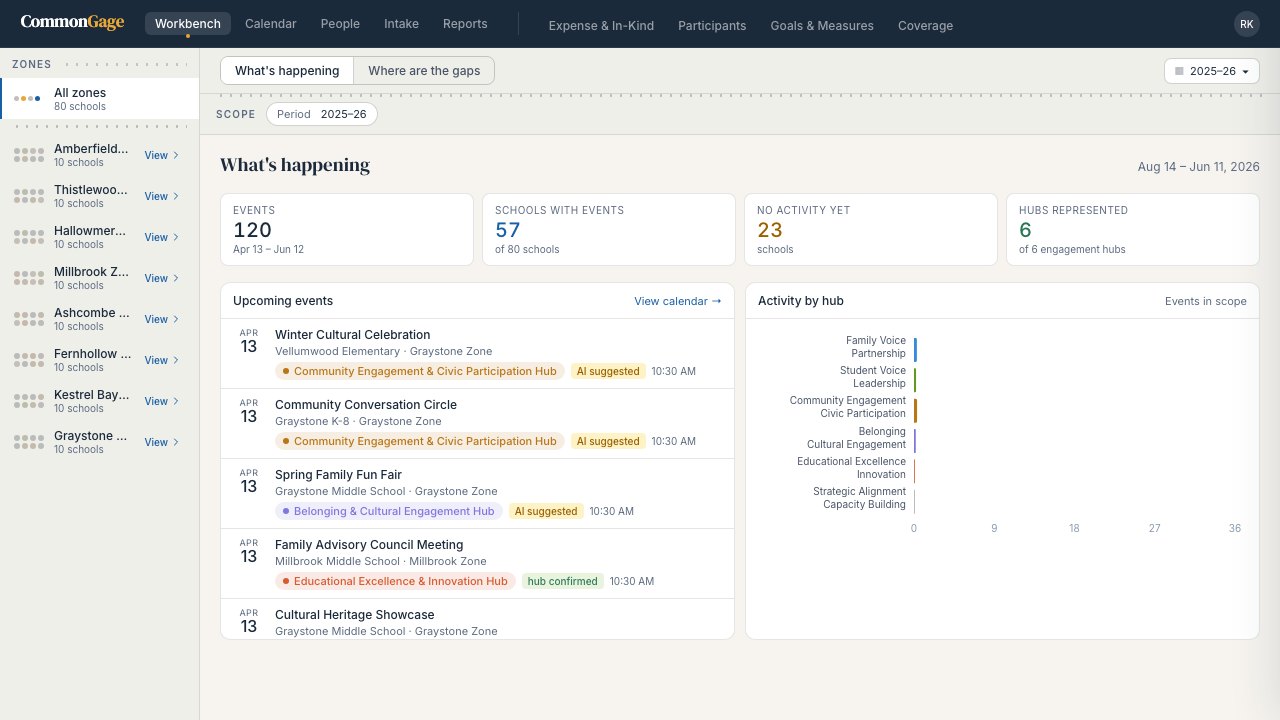
120 events across 57 of 80 schools this year, tagged to 6 engagement hubs — real activity from Riverton's 2025–26 calendar, sitting alongside the compliance record, not instead of it.
03 · Down to one school
Every dot opens into a full record
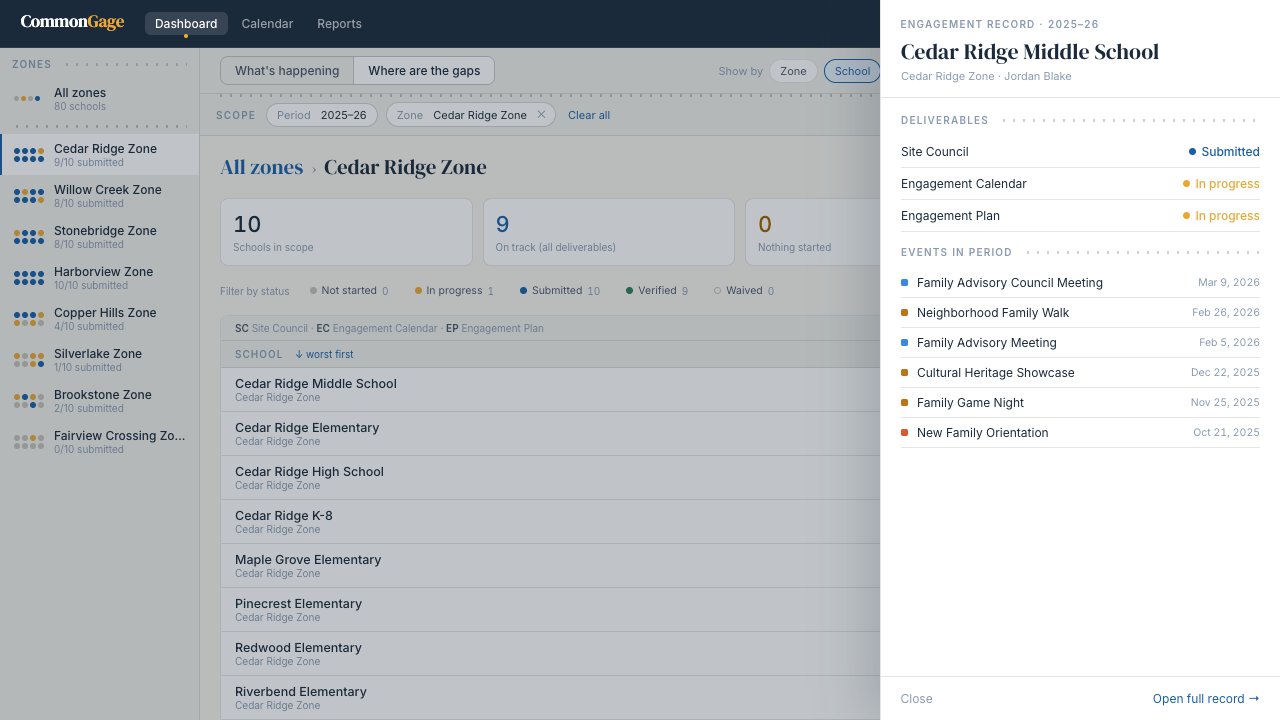
Alderwood Middle School's real record: Site Council verified, Engagement Calendar submitted, Engagement Plan in progress — plus every family engagement event logged this period. The conversation with a principal starts from fact, not memory.
04 · The record, reported
The same record, told as a report
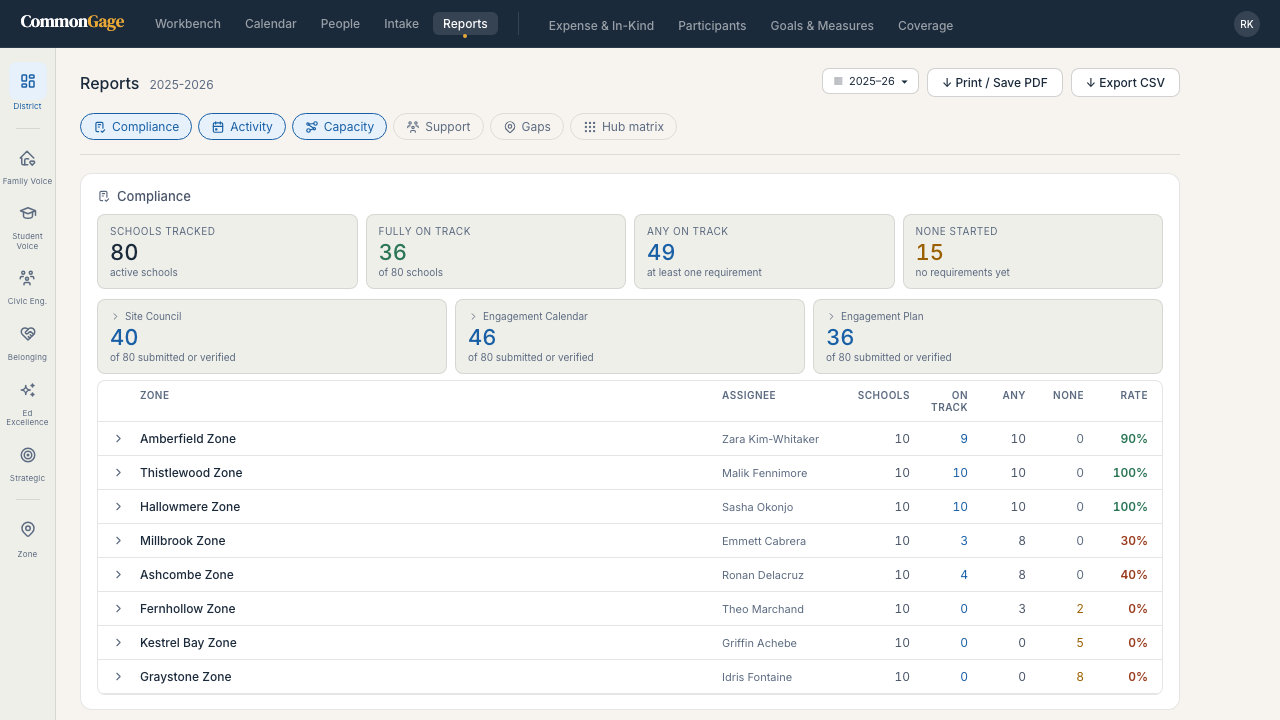
80 schools tracked, 36 fully on track, 15 with nothing started — and every zone's rate broken out beneath it, each one a click from its own record, not a dead end.
05 · What it actually costs
The cost nobody wrote a check for
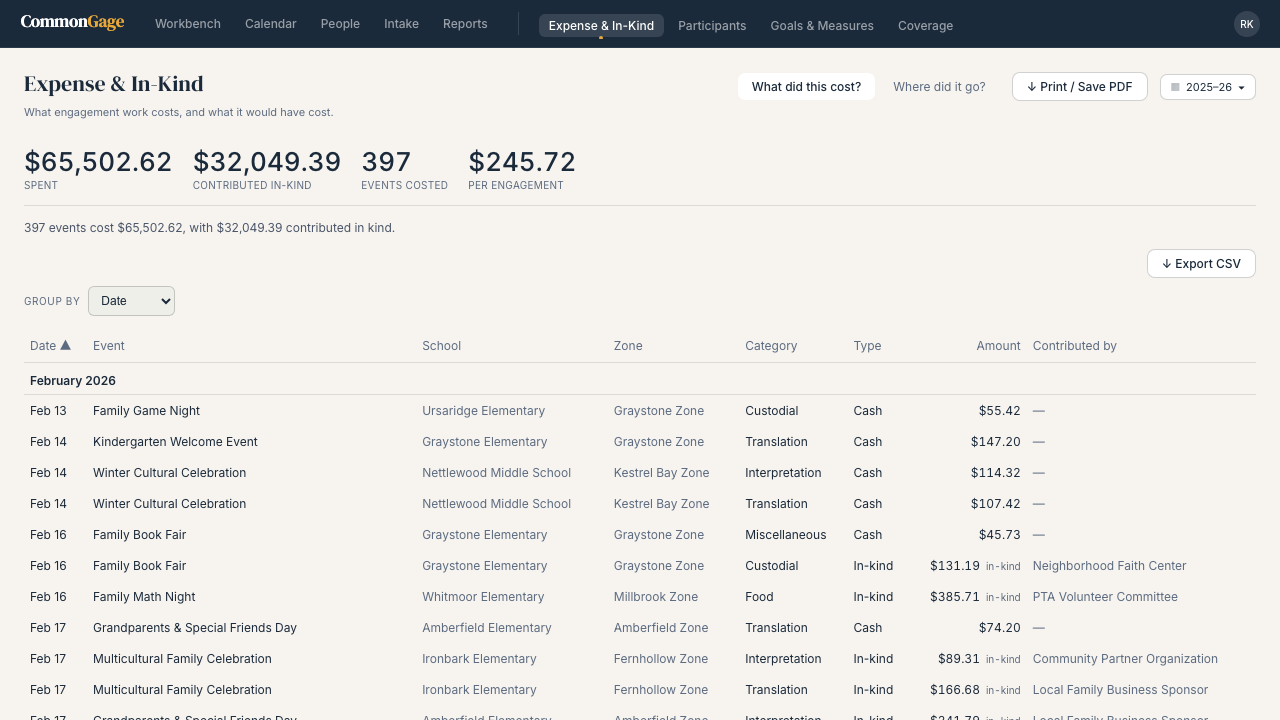
397 events cost $65,502.62 this year — plus $32,049.39 in donated time, space, and goods, tracked down to the contributor, not left as a rounding note in a budget. Five panels, one discipline: nothing about the work stays invisible, cost included. See what it looks like on your own organization.